How I Assess My Performance As A Small Business Owner
I’ve bought, owned, built, and sold multiple small businesses.
I doubled my money with a small cafe. I quadrupled my money with a hair salon, and now I’m on track to 10x my money with a gym.
My job as a business owner is to make decisions that will turn my small business investments into large sums of money.
Yes, business isn’t all about money. In fact, I make very few business decisions based on financial outcomes, but at the end of the day, what’s the point if I’m not making money? I’d probably be better off with a job.
Even though I don’t make many decisions based purely on dollars – I need to know over time if the decisions I’m making are improving the business’s financial position or not.
Media, Social Media and your average joe would have you believe that companies and their leaders should be assessed on revenue, headcount, and growth rate.
Forget all that. Unless you’re a venture capitalist, They don’t matter.
My performance, your performance – anyone responsible for a business’s performance should first and foremost care about the Owners earnings and per-share value of the firm.
Owners’ earnings tell you how well your business is doing now, and per-share value tells you how much the market thinks what you’re doing is worth.
Owners Earnings – Current Financial Position
Owners’ earnings is how much you can feasibly draw from your business after all operating expenses are paid, i.e. it’s what the owners (you) of the business have earned.
This is the calculation.
Owners Earnings = Operating Cashflow – Maintenance Capex (i.e. exclude costs to improve or grow business)
Note operating cash flow is not the same as operating profit. Depending on your business model, these numbers can be wildly different.
Operating cash flow (which you can find on your statement of cash flows) is simply all cash coming into your business, less all cash leaving your business from normal operations.
If your business owns a car and you sell it – that doesn’t count – because that’s not part of your business’s normal operations.
Suppose your business has a loan, and you make repayments. In that case, those are ignored because they are not part of your business’s normal operations.
Maintenance Capex or maintenance capital expenditure is the regular maintenance costs your business incurs to maintain normal operations.
Farms, for example, typically own tractors that require regular maintenance – those are CAPEX costs.
Cafes usually own coffee machines, which require regular maintenance – those are CAPEX costs.
Per Share Value – Future Financial Position
Then there’s per-share value.
This tells you the market value of your business per outstanding share.
Here’s the formula: Per Share Value = Owners Earnings x 3 + Net Asset Value.
We already covered the owner’s earnings above.
Net Asset Value (Which you can find on your balance sheet report) is the value of your business’s assets less the value of your business’s liabilities.
So, for example, if you have cash in the bank of $50,000, vehicles worth $100,000, and machinery worth $500,000 – your business has assets worth $650,000.
And perhaps you have a bank loan of $100,000, accounts payable of $30,000 and an asset finance loan of $30,000—so total liabilities of $160,000.
The net asset value of your business is then $490,000.
And if your owners earnings are $5,000 per month or $60,000 per year, then the value of your business is $180,000 ($60,000 x 3) + $490,000 = $670,000. Then, divide that number by the number of shares outstanding in your business.
If, say, your business has 1,000 shares outstanding, then using the example above, the company’s per-share value is $6,700.
That is what your business is worth; slash can afford you in the future if you sell.
This valuation method is the standard formula most business brokers use to value a small business.
It’s a coarse-grained approach, and an accurate valuation should consider other factors like; key customers, systems, industry trends, etc.
A solid business, even growing marginally like, say, 5% a year, that doesn’t rely entirely on you will fetch close to this figure.
Obviously, you’ll never truly know until you try to sell it, but it’s good enough for a performance assessment.
When these two numbers are increasing – I know, on average, I’m making good decisions. When these numbers are declining, I know I’m making bad decisions on average.
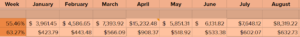
^ This is how my gym is tracking for 2022. Ignoring a couple of random fluctuations on average, we are trending in the right direction. Owners’ earnings have more than doubled; per share, value is up 60+%.